
The EO4EU Platform provides powerful tools for data analytics and visualisation, designed to help users interpret and present Earth Observation (EO) data effectively.
These tools support decision-making by delivering real-time analysis, interactive mapping, and personalised dashboards powered by advanced statistical metrics and a smart search engine.
Interactive dashboards are central to modern business intelligence and data interpretation across various industries, including IT, finance, telecom, and healthcare.
The EO4EU Dashboard embraces these principles by automatically generating dynamic visualisations from raw data and TIFF files, while also allowing users to customise charts and image plots according to their needs.
Using the Data Visualisation Dashboard
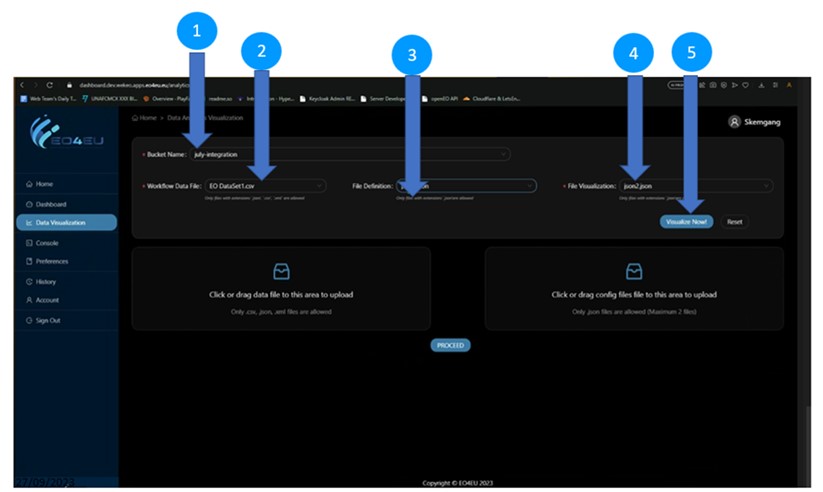
The Dashboard-Data Visualization Deployment consists of 5 sequential steps, such as:
1. Bucket Name – Query Entry: This entry requires the bucket name selection by the end-user.
2. Work-flow Data File – Query Entry: This consists of the Metadata file that has been generated by the WFE in the specified stage of WFE output.
3. File Definition – Query Entry: This includes the dataTypeConfig.json file created by the WFE and is automatically and dynamically generated. The dataTypeConfig.json file defines the data type and structure-format of the metadata to be accessed and read.
4. File Visualization – Query Entry: This includes the dataVisConfig.json file created by the WFE and is automatically and dynamically generated. In particular, it includes the Visualization settings, type of selected charts-plots, and data style to be plotted.
5. Visualize Now!: This defines an activation button to automatically and dynamically plot the charts and data that have been processed through the WFE.
Latest Features Implemented
Driven by user feedback and real-world use cases, the EO4EU Web-Portal and Data Analytics Visualisation Dashboard have been significantly upgraded to improve both functionality and usability.
- Expanded File Format Support: Compatibility with shapefile, NetCDF, TIFF, and TIF datasets.
- Customisable layers with advanced controls for colour, opacity, and visibility.
- Interactive Legends: Detailed, customisable legends for each data layer.
- Real-Time Notifications: A new Notification Manager keeps users informed with real-time updates on workflow progress and data availability, enhancing overall platform responsiveness.
- Custom workflow naming for better organisation.
- API-Centric Architecture: All dashboard features communicate via the OpenEO API, ensuring reliable, centralised data exchange and smooth integration with other components like XR/VR interfaces.
Data Visualisation
Map Visualisation
EO4EU Map & Data Visualisation
Functionality
This videos showcase the map and data visualisation capabilities of the EO4EU Platform. Users can explore Earth Observation data through interactive maps and dashboards, enabling more profound insight into geospatial and temporal patterns. The system supports real-time analysis, filtering, and multi-layered visualisation for intuitive exploration.
Features & Benefits
- Interactive Maps – Visualise EO datasets in widely used geospatial formats such as TIFF, TIF, GeoTIFF, Shapefiles (zip) and NetCDF (nc), with support for overlaying and combining multiple data layers.
- Dynamic Dashboards – Create and interact with dynamic dashboards that support >5 different types of graphs and charts, including advanced 3D surface plots for richer data interpretation.
- Smart Search & Filtering – Quickly locate relevant data using advanced search and filtering functions to build focused visual insights.
- Data Interpretation – Tools for temporal and spatial analysis help uncover trends and patterns in environmental data.
- Decision Support – By presenting complex EO data in an accessible way, the visualisation tools support research, policy-making, and operational decision processes.